*The picture in the header was taken from here.
This web page was produced as an assignment for Genetics 677, an undergraduate course at UW-Madison.
______________________________________________________________________________________________________
Phylogeny
Phylogeny trees are important to show how well conserved a particular protein is across species. If a protein is conserved across many species, it signifies that it is an important protein and usually is required for the survival of the organism. Besides that, the phylogeny tree allows us to see how well conserved a protein is in a particular organism to determine whether the organism is suitable to be used as a model organism for a particular research. If an organism has a highly conserved gene or protein of our interest, we could use it for further research or drug testings.
In this section, the protein sequences from the 7 organisms were aligned with different algorithms, such as ClustalW2, MUSCLE and T-COFFEE. Phylogeny trees were then generated based on the aligned sequences by using ClustalW2, Phylogeny.fr and GeneBee. All algorithms were used with their default options unless noted otherwise.
Sequence Alignment Data
Source: Here
|
Source: Here
|
Source: Here
|
||||||
Phylogeny Trees
Phylogeny Tree 1

Figure 1: Phylogeny Tree by ClustalW2, using the Neighbor Joining % Identity
Changed options:
Pairwise Alignment Options: Protein Weight Matrix: BLOSUM
Multiple Sequence Alignment Options: Protein Weight Matrix: BLOSUM
Changed options:
Pairwise Alignment Options: Protein Weight Matrix: BLOSUM
Multiple Sequence Alignment Options: Protein Weight Matrix: BLOSUM
Phylogeny Tree 2
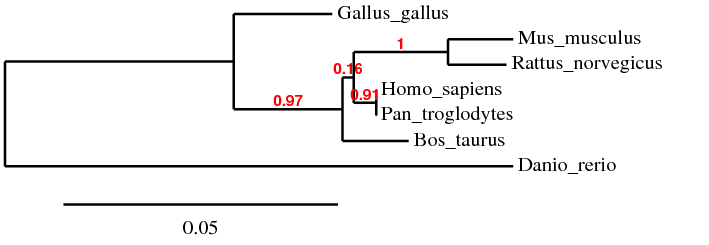
Figure 2: Phylogeny Tree constructed by Phylogeny.fr, using "One Click" Mode and MUSCLE alignment algorithm
Red values represent branch support values [5]
Red values represent branch support values [5]
Phylogeny Tree 3
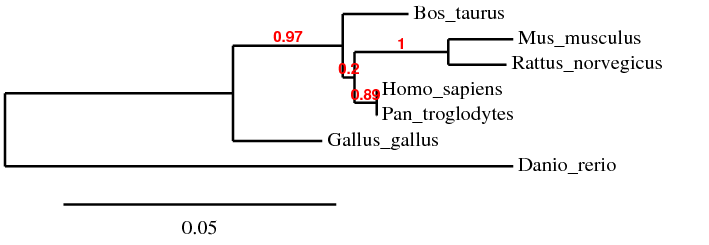
Figure 3: Phylogeny Tree generated by Phylogeny.fr, using "A la Carte" Mode and T-Coffee alignment algorithm
Red values represent branch support values [5]
Red values represent branch support values [5]
Phylogeny Tree 4
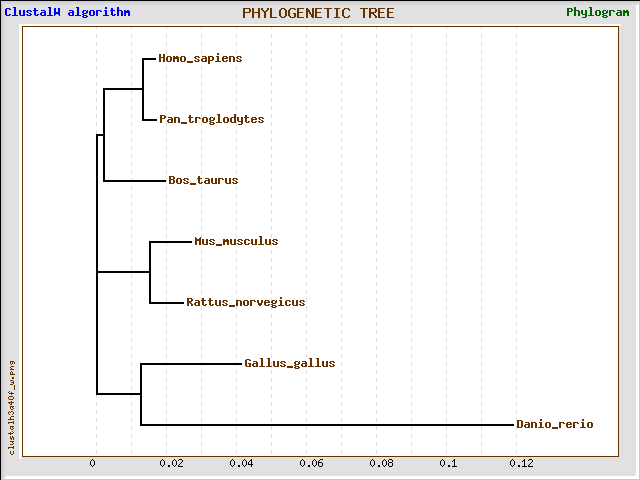
Figure 4: Phylogeny Tree created by GeneBee, using ClustalW2 alignment algorithm
Analysis
It is interesting to note that the 4 phylogeny trees generated by different alignment algorithms and programs do not look identical. This is probably due to the different methods each algorithm used to align the sequences and the different perimeters that the programs used when drawing the phylogeny trees. In Phylogeny Tree 1 and 4, the sequences were aligned using the same algorithm, ClustalW2 but the trees were created using different programs. Therefore, both trees looked slightly different. Phylogeny Tree 2 and 3 were drawn using the same program, Phylogeny.fr but the sequences were aligned using different algorithms, namely MUSCLE and T-Coffee. This explains why the four trees looked different although the sequences used to generate these trees were the same.
Despite appearing different, all 4 phylogeny trees show that the Homo sapiens and Pan troglodytes homologs are the most similar. They also suggest that the Mus muculus and Rattus norvegicus homologs are closely related. Bos taurus remains an outgroup of Homo sapiens and Pan troglodytes while the Danio rerio homolog is the most distant from Homo sapiens. These make sense because both humans and chimpanzees are primates, both mice and rats are rodents while the zebrafish is from a different phylum.
From the phylogeny trees, mouse seems to be the best model organism to be used in the research of the UBE3A gene. Although the UBE3A protein in mouse is not the closest to that in human (owing to the fact that both are from different orders), it is still well conserved in mouse. Besides that, mouse is small, easy to be taken care of, and has a moderate life cycle.
References:
[1] ClustalW2
[2] MUSCLE
[3] T-Coffee
[4] Phylogeny.fr
[5] Phylogeny.fr Documentation
[6] GeneBee
[7] Dereeper A., Audic S., Claverie J.M., Blanc G. BLAST-EXPLORER helps you building datasets for phylogenetic analysis. BMC Evol Biol. 2010 Jan 12;10:8. (PubMed)
[8] Dereeper A.*, Guignon V.*, Blanc G., Audic S., Buffet S., Chevenet F., Dufayard J.F., Guindon S., Lefort V., Lescot M., Claverie J.M., Gascuel O. Phylogeny.fr: robust phylogenetic analysis for the non-specialist. Nucleic Acids Res. 2008 Jul 1;36(Web Server issue):W465-9. Epub 2008 Apr 19. (PubMed) *: joint first authors
[9] Notredame C., Higgins DG., Heringa J. T-Coffee: A novel method for fast and accurate multiple sequence alignment. J Mol Biol. 2000, Sep 8;302(1):205-17. (PubMed)
[10] Castresana J. Selection of conserved blocks from multiple alignments for their use in phylogenetic analysis. Mol Biol Evol. 2000, Apr;17(4):540-52. (PubMed)
[11] Guindon S., Gascuel O. A simple, fast, and accurate algorithm to estimate large phylogenies by maximum likelihood. Syst Biol. 2003, Oct;52(5):696-704. (PubMed)
[12] Anisimova M., Gascuel O. Approximate likelihood ratio test for branchs: A fast, accurate and powerful alternative. Syst Biol. 2006, Aug;55(4):539-52. (PubMed)
[13] Chevenet F., Brun C., Banuls AL., Jacq B., Chisten R. TreeDyn: towards dynamic graphics and annotations for analyses of trees. BMC Bioinformatics. 2006, Oct 10;7:439. (PubMed)
______________________________________________________________________________________________________
If you find my website helpful, please consider donating to the Foundation for Angelman Syndrome Therapeutics (FAST)

Created by Jonathan Mok
[email protected]
Last updated 02/23/2012
Genetics 677

Created by Jonathan Mok
[email protected]
Last updated 02/23/2012
Genetics 677
